Adroddiad sefyllfaol COVID-19: 19 Awst 2021
Diweddariad gan Gell Wybodaeth COVID-19 a'r Grŵp Ymgynghorol Diogelu Iechyd.
Efallai na fydd y ffeil hon yn gyfan gwbl hygyrch.
Ar y dudalen hon
Crynodeb yr adroddiad ar sefyllfa COVID-19
Y pwyntiau allweddol i'w nodi
Symudodd Cymru i Lefel Rhybudd 0 ar 7 Awst.
Mae achosion cyffredinol COVID-19 a phositifedd profion wedi cynyddu ledled Cymru, yn dilyn lleihad bychan wythnos diwethaf. Mae'n anodd dweud gyda sicrwydd ar hyn o bryd, pa effaith fydd symud i lefel rhybudd 0 yn ei gael ar drosglwyddiad yng Nghymru, gan nad oes digon o amser wedi bod i roi arwydd clir. Bydd angen i ni fonitro cyfraddau achosion a dangosyddion allweddol eraill ym mhob gwlad yn ofalus i ddeall effaith llacio'r cyfyngiadau a dychwelyd i'r ysgol yn well.
Mae amcangyfrif consensws y Gyd-ganolfan Bioddiogelwch (JBC) ar gyfer y rhif atgynhyrchu yng Nghymru rhwng 0.9 a 1.2, tra bod amcangyfrif Iechyd Cyhoeddus Cymru (PHW) rhwng 1.3 a 1.4. Ffynhonnell: JBC/ PHW (19/8/21). Sylwer bod fel arfer oedi o 2 i 3 wythnos yn amcangyfrif JBC a bod oedi yn achos amcangyfrif PHW, sy’n defnyddio methodoleg wahanol, o tua 1 wythnos. Sleid 3, Ffynhonnell: PHW.
Mae'r tuedd ar gyfer nifer mewn gwelyau yn yr ysbyty gyda COVID-19 yng Nghymru ar hyn o bryd yn ansicr, ond mae'n ymddangos ei fod yn sefydlog ar 220 o gleifion cysylltiedig â COVID-19 (Amheuaeth, Cadarnhawyd, a oedd yn Gwella) sydd mewn gwely ysbyty ar 18 Awst, ar ôl cynyddu drwy fis Gorffennaf o lefel isel. Mae'r tuedd ar gyfer nifer y cleifion COVID-10 mewn gwelyau yn yr ysbyty gyda chymorth anadlu mewnwthiol yn ymddangos ei fod yn cynyddu ar ôl sefydlogi wythnos diwethaf, gyda 26 o gleifion gydag Amheuaeth o neu Gadarnhad o COVID-19 mewn gwelyau gofal critigol yng Nghymru. Mae derbyn i ysbyty COVID-19 o gleifion COVID-19 a amheuir neu a gadarnhawyd ar eu lefelau isaf ers i'r pandemig ddechrau ar hyn o bryd, gyda chyfartaledd o 15 claf y diwrnod ar 17 Awst.
Ar 17 Awst 2021, roedd gan Gymru 15,341 o achosion a gadarnhawyd o'r amrywiolyn amlycaf Delta (cynnydd o 1,981 o'r wythnos flaenorol). Ni chanfuwyd unrhyw amrywiolyn sy’n peri pryder arall yng Nghymru. Mae data ynghylch statws brechu'r achosion a derbyniadau i’r ysbyty yn cael eu diwygio gan Iechyd Cyhoeddus Cymru ar hyn o bryd felly nid ydynt ar gael. Ffynhonnell: PHW.
Ar 18 Awst, mae cyfanswm o 4,470,306 (+49,136) o ddosau o frechlyn COVID-19 wedi eu rhoi yng Nghymru a'u cofnodi yn System Imiwneiddio COVID-19 Cymru. O'r rhain roedd 2,320,165 (+18,567) yn ddosau cyntaf a 2,150,141 (+30,659) yn ail ddosau. Yn ddiweddar cymeradwyodd y JCVI frechiad dos cyntaf i bobl 16 ac 17 oed yn y DU, ac mae hyn wedi cychwyn yn ddiweddar yng Nghymru. Ffynhonnell: PHW, SPI-M-O.
Dangosyddion allweddol
Mae nifer o ddangosyddion allweddol yn dangos cynnydd, yn dilyn gostyngiadau yn yr wythnosau diweddar.
Sylwer bod y saethau yn cynrychioli newid mewn cymhariaeth â’r wythnos ddiwethaf.
| Gwerth Cyfredol (14/08/21) | Newid ers yr wythnos flaenorol (07/08/21 - 14/08/21 oni nodir fel arall) | ||||
|---|---|---|---|---|---|
| Newid mewn canran | Newid mewn gwerth | ||||
| Cyfradd yr achosion a gadarnhawyd (swm 7 diwrnod treigl fesul 100k) | 209 | +46% | ↑ | (+66) | |
| Cyfradd achosion a gadarnhawyd yn y rheini dros 60 oed (swm 7 diwrnod treigl fesul 100k) | 87 | +52% | ↑ | (+30) | |
| Positifedd profion (Cyfartaledd treigl 7 diwrnod) | 13.7% | +32% | ↑ | (+3.4 pwynt canrannol) | |
| Y boblogaeth yr amcangyfrifir bod ganddi COVID-19 (cyffredinrwydd)1 | 0.77% | +67% | ↑ | (+0.31 pwynt canrannol) | |
| Derbyniadau COVID-19 y GIG2 | 16 | +11% | ↑ | (+2) | |
| Marwolaethau ONS (swm 7 diwrnod)3 | 18 | -10% | ↓ | (-2) | |
| Marwolaethau PHW (swm 7 diwrnod) | 11 | -21% | ↓ | (-3) | |
- Mae’r data diweddaraf a gafwyd o’r Arolwg Heintiadau COVID-19 ar gyfer y cyfnod o 8 Awst 2021 i 14 Awst 2021.
- Y cyfartaledd treigl saith diwrnod hyd at y dyddiad presennol o gleifion y cadarnhawyd bod ganddynt COVID-19, nid yw’n cynnwys cleifion y mae amheuaeth bod ganddynt COVID-19 neu sy’n gwella.
- Mae data marwolaethau diweddaraf ONS hyd at 6 Awst 2021 (yn hytrach na 14 Awst 2021) ar gyfer y gwerth cyfredol. Defnyddir data hyd at 30 Gorffennaf 2021 ar gyfer y newid ers yr wythnos flaenorol.
What is the current status of the epidemic?
| Local Authority | Number | % of All Wales Total | Case Incidence per 100,000 | Change from previous week |
|---|---|---|---|---|
| Denbighshire | 337 | 5.8% | 352.2 | 17% ↑ |
| Conwy | 296 | 5.1% | 252.6 | 5% ↑ |
| Wrexham | 336 | 5.8% | 247.1 | 23% ↑ |
| Newport | 384 | 6.6% | 248.3 | 53% ↑ |
| Flintshire | 363 | 6.2% | 232.5 | 24% ↑ |
| Bridgend | 244 | 4.2% | 165.9 | 8% ↑ |
| Monmouthshire | 143 | 2.5% | 151.2 | 8% ↑ |
| Vale of Glamorgan | 188 | 3.2% | 140.7 | 18% ↑ |
| Powys | 241 | 4.1% | 182.0 | 30% ↑ |
| Swansea | 446 | 7.7% | 180.6 | 48% ↑ |
| Neath Port Talbot | 295 | 5.1% | 205.8 | 82% ↑ |
| Cardiff | 549 | 9.4% | 149.6 | 29% ↑ |
| Gwynedd | 249 | 4.3% | 199.9 | 74% ↑ |
| Torfaen | 186 | 3.2% | 198.0 | 69% ↑ |
| Merthyr Tydfil | 74 | 1.3% | 122.7 | 9% ↑ |
| Blaenau Gwent | 112 | 1.9% | 160.3 | 67% ↑ |
| Caerphilly | 252 | 4.3% | 139.2 | 28% ↑ |
| Rhondda Cynon Taf | 438 | 7.5% | 181.5 | 80% ↑ |
| Isle of Anglesey | 96 | 1.7% | 137.1 | 43% ↑ |
| Carmarthenshire | 210 | 3.6% | 111.2 | 21% ↑ |
| Pembrokeshire | 199 | 3.4% | 158.2 | 69% ↑ |
| Ceredigion | 103 | 1.8% | 141.7 | 84% ↑ |
| Unknown | 69 | 1.2% | - | 17% ↑ |
| Total | 5810 | 100.0% | 142.4 | -1% ↓ |
At a Wales level, on 12 August 2021, the 7-day rolling incidence of COVID-19 cases and percentage of people testing positive for COVID-19 have sharply increased since last week (slide 2).
The JBC consensus Reproduction number (Rt) estimate for Wales is between 0.9 and 1.2 (19 August 2021) , with daily growth rate of between -2% and +7 % and a doubling time of flat to doubling every 10 days. Using PHW positive test data only (more timely data but limited by variation in testing), Rt is estimated to be between 1.3 and 1.4 for Wales (18 August 2021). The central Rt estimate is highest for the Swansea Bay and Hywel Dda health boards at 1.6. Source: JBC/PHW.
7-day cumulative case incidence in Wales has increased by 35% to 184.3 per 100,000 population in the last week.
Case incidence is increasing in all of the 22 local authorities. Case incidence is above 200 per 100,000 population for 6 of the 22 local authorities. Local authorities with the highest case incidences are Denbighshire and Conwy at 352.2 and 252.6 per 100,000 population, respectively.
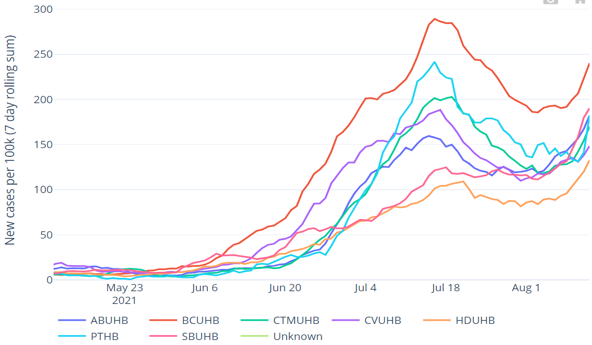
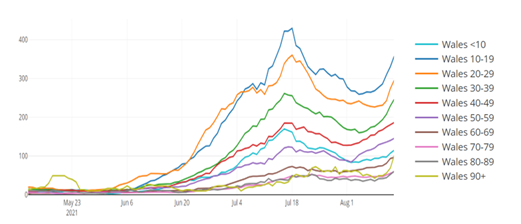
Case incidence is highest in those aged 10-19 and 20-29. Case incidence has decreased throughout the last few weeks in these age groups, but has increased in the latest week. Case incidence is highest for the Betsi Cadwaladr health board and increasing for all health boards.
The second table below provides estimates of doubling and halving times based on PHW COVID-19 positive test data. In this table, doubling times are positive, whilst halving times are negative. The 95% confidence intervals are showing in brackets after the central estimate. An asterisk (*) means that there are small numbers and estimates should be treated with caution. Local health board level estimates of Rt and halving times will be unstable when incidence is low.
| Area | Rt (cases) | Halving time (days) |
|---|---|---|
| All Wales |
1.4 (1.3 to 1.4) |
12 (8 to 23) DOUBLING |
| Swansea Bay UHB |
1.6 (1.5 to 1.7) |
8 (7 to 12) DOUBLING |
| CTM UHB |
1.5 (1.4 to 1.5) |
10 (6 to 23) DOUBLING |
| Aneurin Bevan UHB |
1.4 (1.3 to 1.4) |
13 (8 to 28) DOUBLING |
| Cardiff & Vale UHB |
1.2 (1.1 to 1.3) |
14 (9 to 36) DOUBLING |
| Hywel Dda UHB |
1.6 (1.5 to 1.7) |
9 (6 to 14)* DOUBLING |
| Powys THB |
1.5 (1.3 to 1.6) |
10 (5 to 595)* DOUBLING |
| Betsi Cadwaladr UHB |
1.3 (1.3 to 1.4) |
15 (9 to 43) DOUBLING |
Cases per 100k (PHW Data) (7 day rolling sum)
Cases per 100k by age (PHW Data) (7 day rolling sum)
Data as at 12:00PM 18 August 2021 unless otherwise specified.
What is the situation with the NHS and social care?
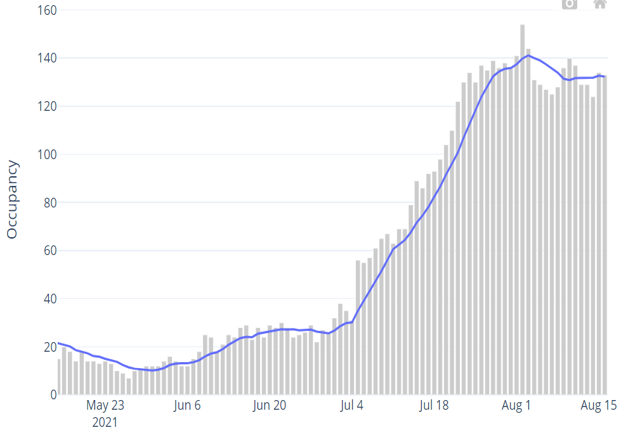
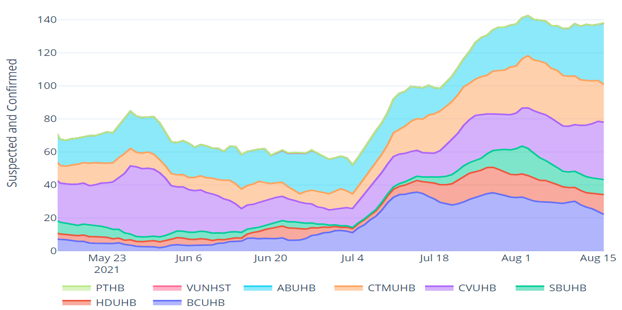
COVID-19 pressure on the NHS has been generally increasing over recent weeks. As at 18 August 2021, there were 220 COVID-19 related patients (Suspected, Confirmed and Recovering) occupying a hospital bed. This compares to 202 (18 more occupied beds) on 11 August 2021. Confirmed patients accounted for 146 of the total occupied beds.
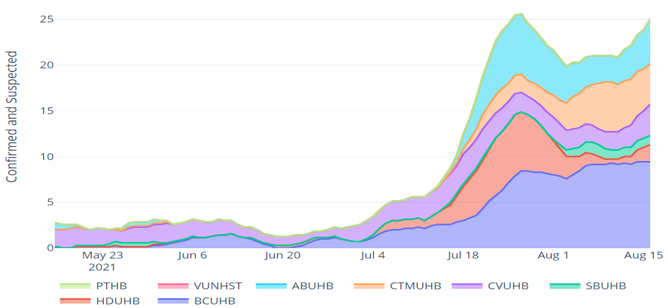
There are 26 patients with Suspected or Confirmed COVID-19 in critical care beds in Wales. This is 138 lower than the maximum COVID-19 position of approximately 164. The total number of patients in critical care for both COVID-19 and non-COVID-19 stands at 160, 8 more than the historic maximum critical care capacity of approximately 152.
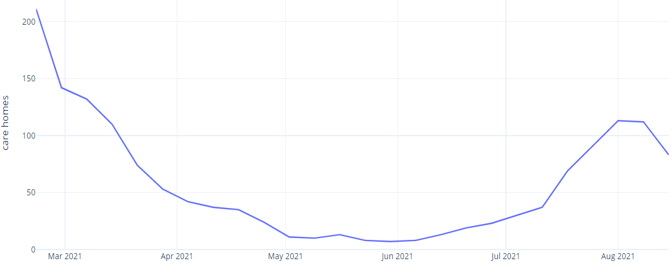
In the latest National Situation Background Assessment Recommendation (SBAR) report covering the week of 9 August 2021 to 15 August 2021, IMTs reported 83 care homes were in 'red' status (an ongoing outbreak/incident reported within the last 7 days), with 1 health board reporting having no care homes in 'red' status. This is compared with 112 care homes in 'red' status in the 7 days up to 8 August 2021. Source: National SBAR.
Confirmed hospital occupancy (7 day rolling average)
Overall invasive ventilated bed occupancy (7 day rolling average)
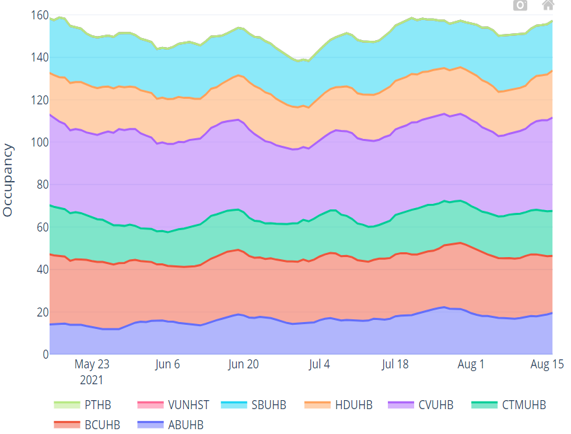
Hospital bed occupancy for suspected and confirmed COVID-19 positive patients (7 day rolling average)
Invasive ventilated bed occupancy for suspected and confirmed COVID-19 positive patients (7 day rolling average)
Number of adult care homes reported an ongoing outbreak/incident (last 7 days)
Wastewater Monitoring for COVID-19
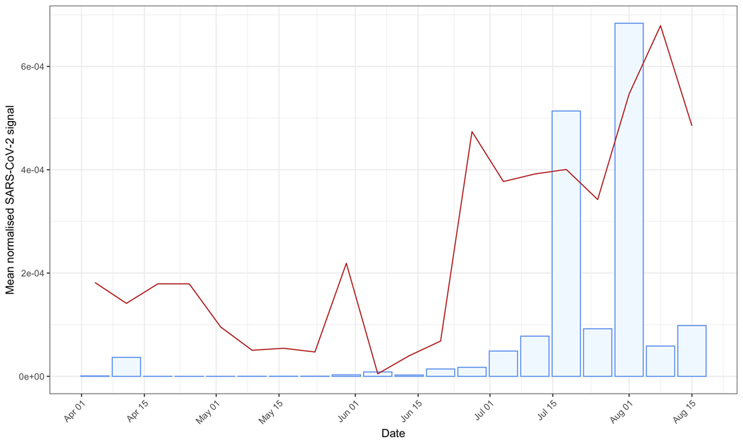
In the recent period up to 15 August 2021, the wastewater signal broadly confirms the national trend in positive COVID-19 cases (PHW) over the same period.
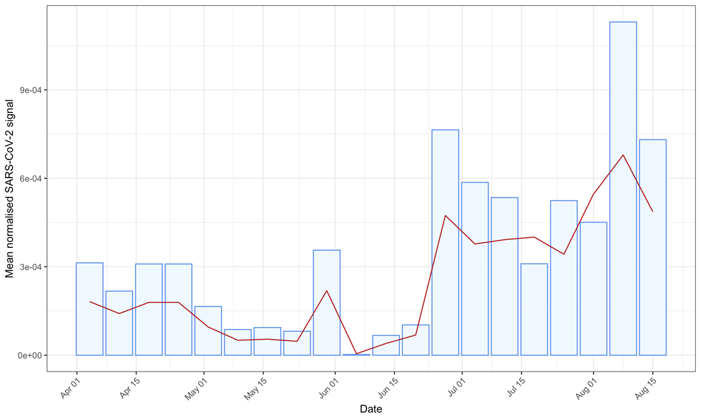
The normalised wastewater SARS-CoV-2 signal across North Wales sites was relatively stable last week and over the past 4 weeks. The slight rise across South Wales reported last week has reversed. Comparing the week ending 15 August 2021 with the previous week, there are still differences between the change in SARS-CoV-2 signal from wastewater data and the change in COVID-19 case incidence data (PHW) over the same time period. (See table below.)
Wastewater signal is a relatively unbiased indicator because it is not dependent on testing policy and behaviour. The characteristics of the individual sewerage systems could have an impact on the signal being seen. Subsequently, the relationship between cases and wastewater signal is still being investigated.
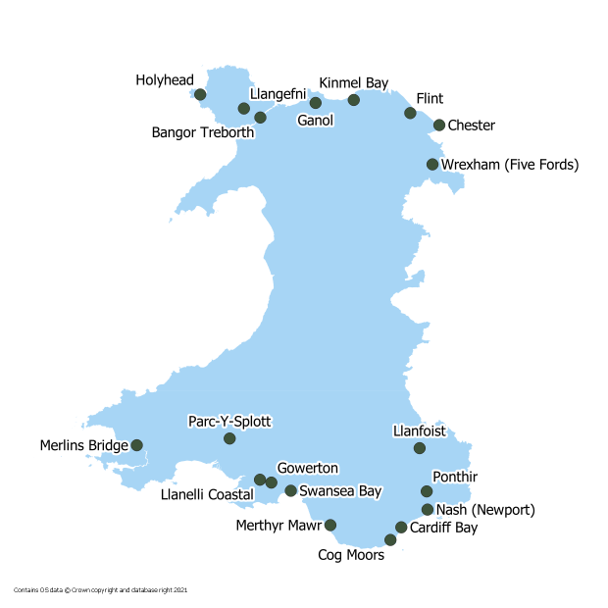
Sites/regions on the watch-list (increases and/or divergence between SARS-CoV-2 signal and corresponding LSOA PHW COVID-19 case data over the past 2-4 weeks): Kinmel Bay, Treborth in North Wales; and Newport, Cog Moors, Merthyr Mawr, Swansea Bay in South Wales.
Wastewater SARS-CoV-2 signal data below limit of detection recorded as zero. The wastewater data for individual WwTW sites, normalised and unnormalised are inherently noisy. Sampling from Treborth has not been consistent due to construction work at the site, and this has impacted on the North Wales average figures. Wastewater data analysis and reporting is still in a pilot stage and should not be relied upon in isolation.
|
Region |
Site |
2 to 8 August mean |
9 to 15 August mean |
Fold changea |
|---|---|---|---|---|
|
North Wales |
Chester |
0 |
1 |
b ↑ |
|
North Wales |
Flint |
0 |
0.8 |
b ↑ |
|
North Wales |
Ganol |
1 |
0.6 |
0.6 ↓ |
|
North Wales |
Holyhead |
0 |
0 |
1 |
|
North Wales |
Kinmel Bay |
1.5 |
2.5 |
1.7 ↑ |
|
North Wales |
Llangefni |
0.4 |
0.2 |
0.5 ↓ |
|
North Wales |
Treborth |
0.9 |
1.1 |
1.3 ↑ |
|
North Wales |
Wrexham |
1 |
0.6 |
0.7 ↓ |
|
South Wales |
Cardiff Bay |
19.4 |
10.7 |
0.6 ↓ |
|
South Wales |
Cog Moors |
1.3 |
2.4 |
1.8 ↑ |
|
South Wales |
Gowerton |
17.4 |
5.8 |
0.3 ↓ |
|
South Wales |
Llanelli Coastal |
11.2 |
3.7 |
0.3 ↓ |
|
South Wales |
Llanfoist |
14.1 |
0 |
b |
|
South Wales |
Merlin's Bridge |
0.1 |
0 |
b |
|
South Wales |
Merthyr Mawr |
2.7 |
3.7 |
1.4 ↑ |
|
South Wales |
Newport Nash |
9.2 |
12.4 |
1.4 ↑ |
|
South Wales |
Parc Y Splotts |
12.3 |
11.4 |
0.9 ↓ |
|
South Wales |
Ponthir |
35.3 |
18.5 |
0.5 ↓ |
|
South Wales |
Swansea Bay |
1.3 |
11.8 |
9.1 ↑ |
a: The ratio between the measurement from the most recent week (B) and that of the preceding week (A), i.e. B/A
b: Magnitude of fold change from or to zero cannot be presented numerically
Weekly comparison of North and all-Wales mean normalised SARS-CoV-2 signal.
All-Wales mean signal (red line) and North Wales mean signal (blue bars). Data taken from week ending 4 April 2021.
Weekly comparison of South and all-Wales mean normalised SARS-CoV-2 signal.
All-Wales mean signal (red line) and South Wales mean signal (blue bars). Data taken from week ending 4 April 2021.
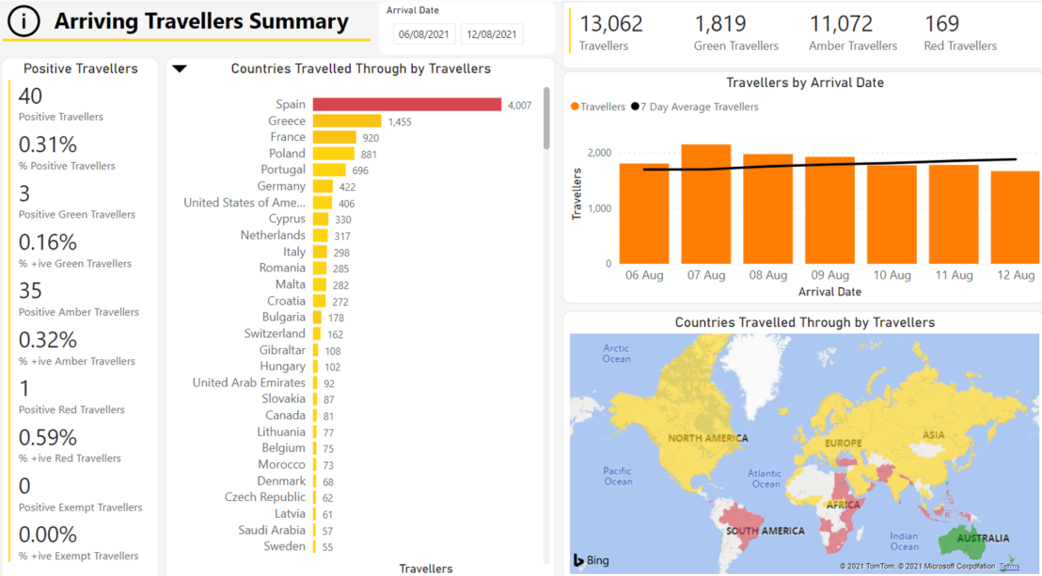
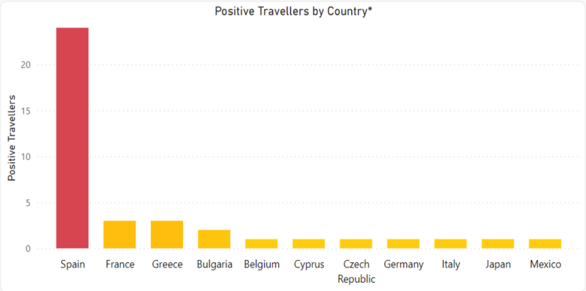
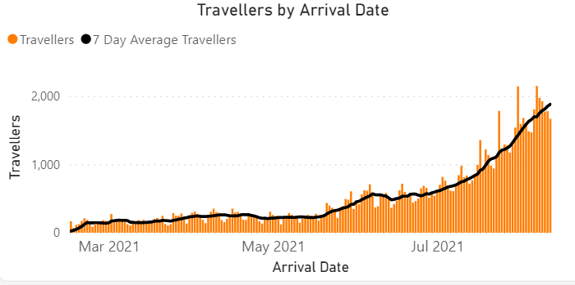
What is the situation with arriving travellers?
There were significant increases in arrivals from Greece, Poland, and Portugal compared to the previous week. However, arrivals from Spain decreased by 573. Requirements are now dependent on vaccination status as per Amber regulations. Fully vaccinated travellers will no longer need to self-isolate or test after arrival.
13,062 total travellers this week (11,504 last week):
- Red: 169 (141 last week)
- Amber: 11,072 (10,224 last week)
- Green: 1,819 (1,139 last week)
40 total positive travellers (61 total last week):
- Red: 1 positive travellers (3 last week)
- Amber: 35 positive travellers (47 last week)
- Green: 3 positive travellers (4 last week)
- 1 positive traveller (not in managed quarantine) isolating outside Wales
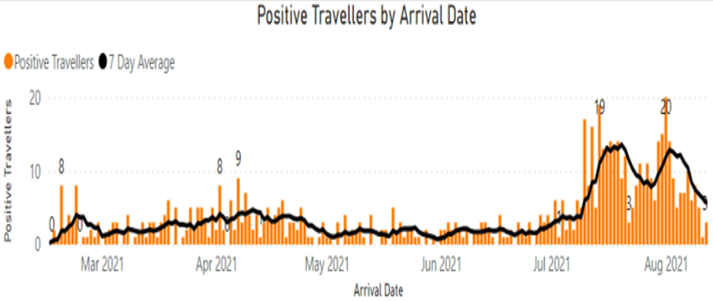
Source: Home Office
Please note that the data provided by the Home Office is derived from Passenger Locator Forms (PLF) which are self-completed by travellers. As such, data may contain inaccuracies. Due to the limitations associated with data capture and legislation, some minor discrepancies may be present in the data.
Mobility data, adherence and UK comparison
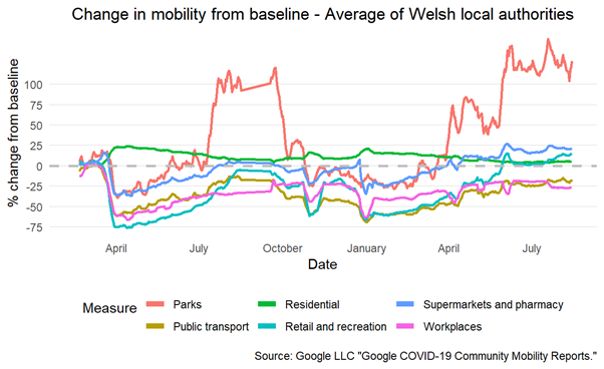
Mobility data by location of trip, Welsh local authorities
The latest mobility data shows increases in the latest week across most categories compared to the previous week with reductions in people spending time at home. The baseline for much of the data is during January to February 2020 and changes are relative to that period. It is not possible to determine if mobility is higher/lower than would have been expected prior to the pandemic as data for 2019 or earlier years is not published.
Adherence
The most recent IPSOS MORI data for the period 30 July to 2 August for Wales shows a reduction compared with the last survey wave in those trying to maintain 2m from people when out, while those only leaving home for essential trips remained steady. It should be noted that this is self-reported adherence and will be affected by individuals’ understanding of the rules and circumstances that apply to them.
The latest results from the Public Engagement Survey on Health and Wellbeing during Coronavirus Measures (2 to 8 August) shows that 81% of people said they understand current restrictions in Wales ‘very well’ or ‘quite well’. When asked ‘how much would you say you are following the restrictions?’ on a scale of 1 to 10, where 10 is ‘completely’, 80% of people ranked themselves at 8 or higher.
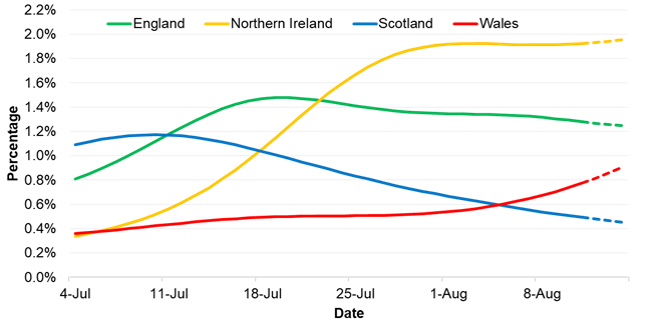
Results from the coronavirus (COVID-19) Infection Survey, 8 to 14 August
The percentage of people testing positive has decreased in England and Scotland in the most recent week. Positivity has increased in Wales in the most recent week, whilst the trend is uncertain in Northern Ireland.
It is estimated that an average of 23,500 people in Wales had COVID-19 (95% credible interval: 16,600 to 31,900), equating to around 1 in 130 people or 0.77% of the community population (up from 0.46% last week). This compares to around 1 in 80 people in England, around 1 in 200 people in Scotland, and around 1 in 50 people in Northern Ireland.
Source: Office for National Statistics COVID-19 Infection Survey.
Positivity rates (%) across UK countries up to 14 August 2021
Vaccine and immunity status
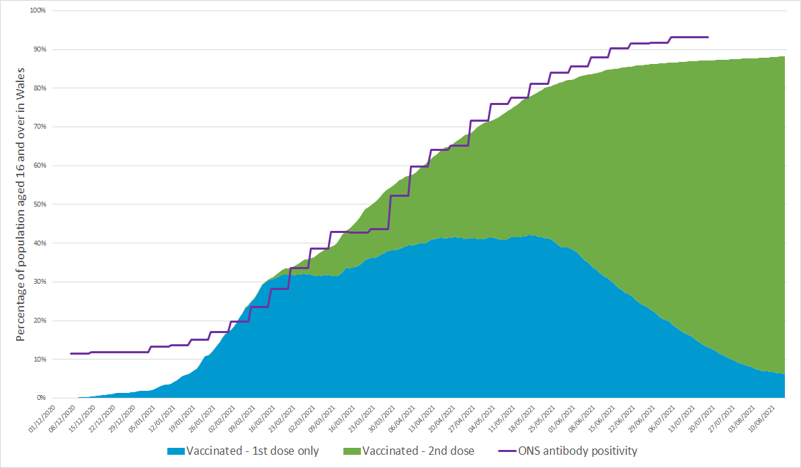
Vaccination and antibody status of individuals aged 16 and over in Wales
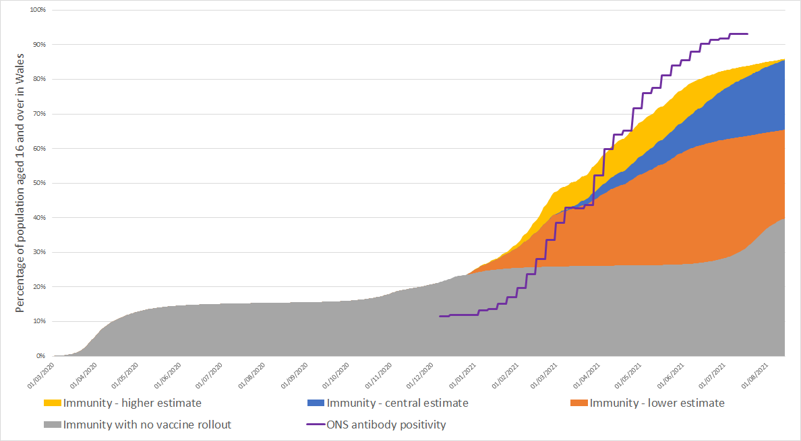
Immunity estimates and antibody status of individuals aged 16 and over in Wales
The COVID-19 vaccination rollout of first doses has slowed in Wales, but rollout of second doses continues to progress well. As at 14 August 2021, 88% of people aged 16 and over had received at least one COVID-19 vaccine dose in Wales. 6% of people aged 16 and over had exactly one vaccine dose and 82% were fully vaccinated.
Between 12 and 18 July 2021, the ONS COVID-19 Infection Survey estimated that 93.2% of the community population aged 16 and over in Wales tested positive for COVID-19 antibodies.
As at 14 August 2021, it is estimated that 86% of people aged 16 and over in Wales had some immunity against COVID-19 infection. The lower and higher estimates of immunity are 65% and 86% of people aged 16 and over in Wales. If no vaccines had been administered, it is estimated that 40% of people aged 16 and over would be immune. These estimates assume 84% of natural infections lead to immunity, but do not account for waning immunity. (SIREN study paper, The Lancet, published 9 April 2021).
It is currently estimated that over 80% (may be closer to 90%) of the population, spread evenly across Wales, must be immune to COVID-19 before population immunity effects would be observed (TAG advice on the Delta variant, published 18 June 2021). Note that the immunity estimate of 86% is for individuals aged 16 and over, not the total Wales population, and varies across age groups.
Differences between antibody presence and immunity estimates include:
- ONS antibody estimates are based on study participants who have volunteered for the study and estimates are extrapolated.
- ONS estimates are based on the 16+ community population, which excludes people in care homes or hospitals. Immunity estimates are based on the whole 16+ Wales population.
- While antibody protection doesn’t equal immunity from infection, it does give a useful indication of the level of protection from infection in the Welsh population.
- Antibody estimates use 2019 mid-year population estimates while the immunity estimates use 2020 mid-year estimates.
What does the situation look like going forward?
Based on the current rates observed with current restrictions:
Cases
The probability of incidence reaching greater than 200 per 100,000 between 29 August and 4 September is above 80% for 10 of the 22 local authorities. The figure illustrates the probability (between 0 – 100%) of incidence being greater than 200 per 100,000. Source: Imperial College London.
Probability of greater than 100 per 100,000 cases by local authority
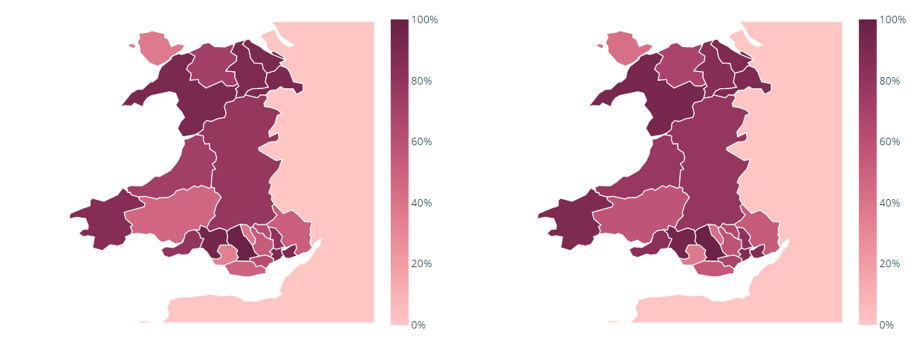
22 to 28 August 2021 and 29 August to 4 September 2021.
Deaths per day
SPI-M's consensus view is that the number of deaths in Wales will remain low compared with previous waves over the next three weeks. Source: Modelled medium term projections, SAGE/SPI-M, 11 August.
Hospitalisations per day
Projected to decrease slightly to around 10 per day over the next three weeks. Source: Modelled medium term projections, SAGE/SPI-M, 11 August.
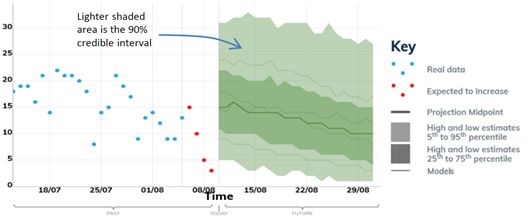
These projections are based on current trends and will not fully reflect the impact of policy or behavioural changes over the past two to three weeks, including the recent downward trend in all UK nations. The projections include the impact of vaccines, but cannot capture any future increases in transmission resulting from new variants. They are not forecasts or predictions.
Key risks and sources
Key risks
Transmissions, incidence and prevalence
Overall transmission of COVID-19 and test positivity has increased across Wales.
Rising trends across health boards and local authorities.
NHS capacity
COVID-19 hospital bed occupancy has been stable over the past few weeks, whilst critical care occupancy has increased over the past week.
Mortality
Low numbers of deaths in the most recent week.
Variants
Wales has 15,341 confirmed cases of the dominant Delta variant (an increase of 1,981 from the previous week) Delta remains the dominant variant of COVID-19 in Wales.
Immunity and vaccines
4.47 (+0.05) million doses of COVID-19 vaccine have been given in Wales, of which 2.32 (+0.02) million were first doses and 2.15 million (+0.03) were second doses. 86% of those aged 16 and over in Wales were estimated to have some immunity against COVID-19 infection at 14 August.
International
There is an increase in traveller numbers this week, however the proportion of travellers testing positive is relatively low.